Today’s post wants to unfurl predictability issues associated with yesterday’s (Wed 3 July 2013) interesting storms, which turned out to be more severe than expected. Thunderstorm activity was associated with a cold front that slowly moved across the Munich domain from the West. Vertical wind shear was weak, and so was the large-scale forcing, as a short-wave trough dived into the Central Mediterranean region instead of overspreading the area of interest. However, a belt of low to moderate CAPE and strong convergence along the front line were sufficient to trigger widespread thunderstorms across Austria, Bohemia and E Germany (see yesterday’s post for a brief outline), which did not only bring the expected heavy rain and marginally large hail events, but also a surprising number of severe wind gusts.
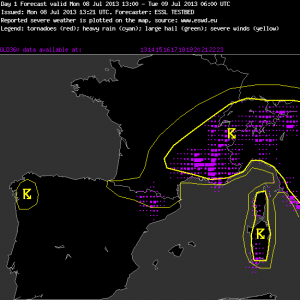
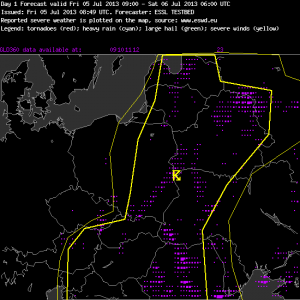
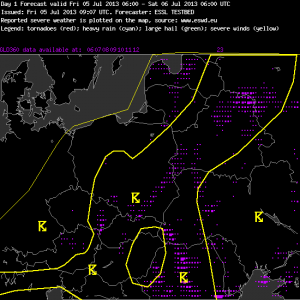
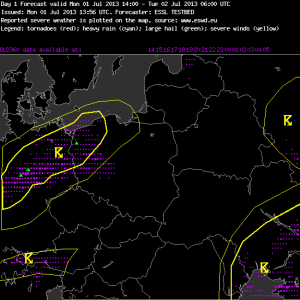
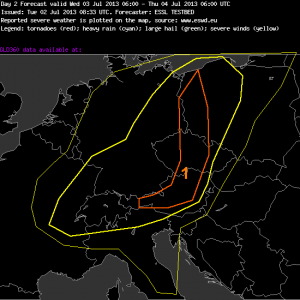
[In all of the following pictures, the thin yellow line is the >15% thunder probability forecast, the thick yellow line is the >50% thunder probability forecast, and the orange line is the 5-15% severe weather probability (“level 1”). The probability numbers refer to a 40 km radius around a given point. From the verification side, magenta dots illustrate the lightning detections, green triangles the large hail reports, yellow V’s the severe wind reports, and blue circles the heavy rain reports.]
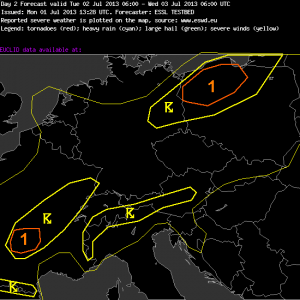
Fig. 1 shows the day 3 forecast for the target day, issued on Monday, which was already quite accurate. The day 2 forecast (Fig. 2) managed to even narrow down the level 1 area in Austria and the Czech Republic, but missed the German events. Interestingly, the day 1 forecast (Fig. 3) was less confident and broadened the level 1 area again. This perceived increase in uncertainty resulted from an observed discrepancy between the model forecasts, which placed the belt of maximum CAPE (and the highest precipitation signals in the afternoon) along the German/Austrian and German/Czech border, and the latest surface observations, which showed the axis of best low-level moisture with dew points up to 17°C about 200 km further East. The applied “correction” of the model forecasts worked out well in Austria but was increasingly counterproductive further North, where the German events were missed and the forecasted events over Poland did not happen.
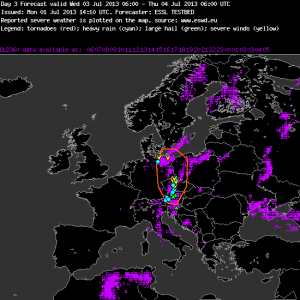
Fig. 1: Verification of the day 3 forecast for Wed 3 July 2013, issued on Monday.
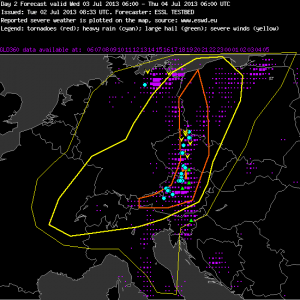
Fig. 2: Verification of the day 2 forecast for Wed 3 July 2013, issued on Tuesday.
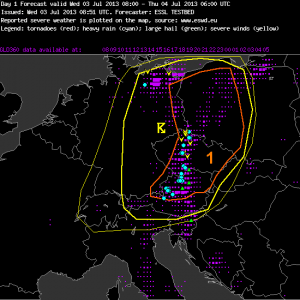
Fig. 3: Verification of the day 1 forecast for Wed 3 July 2013, issued on Wednesday morning.
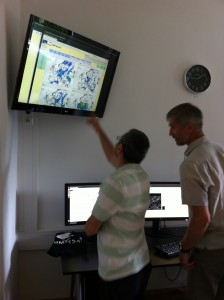
The verification scheme was also lively discussed in today’s verification session, when not even half of Wednesday’s ESWD reports had arrived yet (in particular, all but one wind reports were still missing), and when much of the level 1 area still looked quite empty. A how high coverage of severe weather events would justify a level 1 at all? Or, in Tomas’ words: how much of our “level 1 banana” in Fig. 2 and 3 should be “good” and how much could be “bad” in order to make the whole banana still “good”? The probabilities listed further up in this post, including the 5-15% severe weather probability as our level 1 criterion, refer to a radius of 40 km around a given point, which roughly covers the range of a thunderstorm’s audibility. So a level 1 over this given point can more easily be interpreted as a 5-15% chance that a thunderstorm turns severe within earshot. This implies: if you draw a 40 km radius around each individual severe weather report and the resulting envelope area covers between 5 and 15% of your level 1, your forecast was well calibrated. During the verification session this morning, it was finally agreed that the Southern part of the level 1 area was fine but the Northern part over Poland was a false alarm. With the lot of new severe weather reports which have arrived in the course of today, it now even looks like the Southern part may have deserved a level 2, meaning a >15% probability of severe weather within 40 km of a given point.
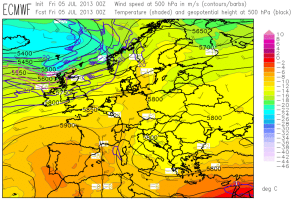
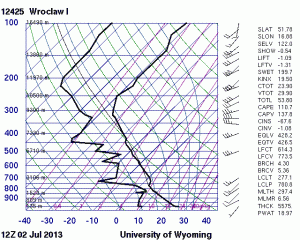
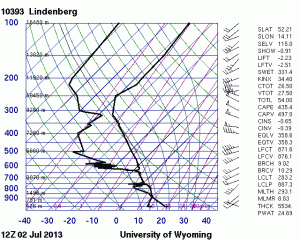
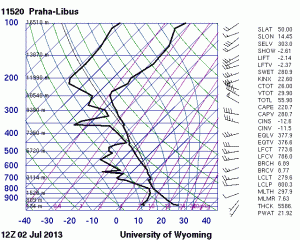
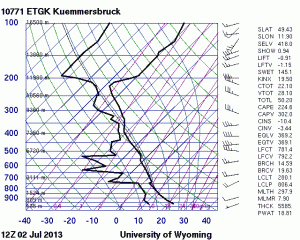
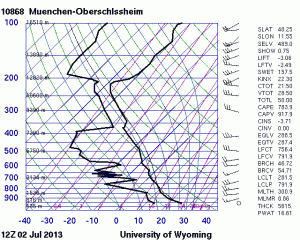
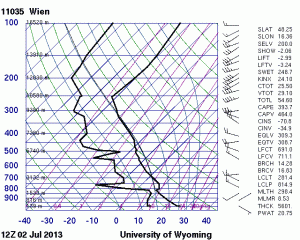
While a risk of heavy rain and of marginally large hail (note: each of the hail reported to ESWD was only 2 cm in size) was well forecasted, the number of severe wind events was quite surprising. Two things struck us in the 12 UTC soundings (Fig. 4) when we searched for possible reasons:
(1) The Vienna sounding (though situated a bit further to the East) showed very dry layers of air around 800 hPa, which could – together with the Southwesterly flow at this level – be interpreted as a result of subsidence in the wake of the Alps. These dry layers, given that they spread over Northern Austria and parts of the Czech Republic, could have been a reason to enhance evaporative cooling and increase the gust potential. This explanation, of course, does not hold for the severe wind events in NE Germany, far away from any mountains.
(2) The glance at 0-6 km vertical wind shear may have been misleading, since the 12 UTC soundings from Lindenberg, Prague and Vienna uniformly showed that the 0-3 km shear was even higher than the 0-6 km shear along with nice veering, which may have been marginally supportive of a better storm organization with an attendant higher threat of severe wind gusts.
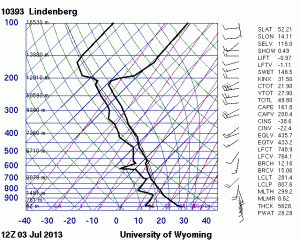
Fig. 4a
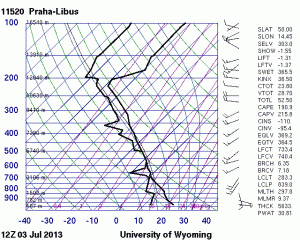
Fig. 4b
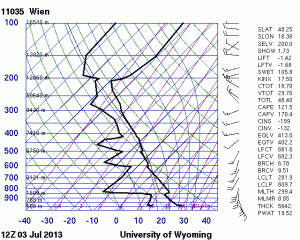
Fig. 4c.
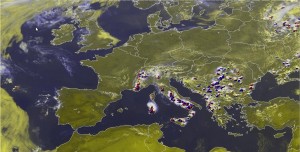
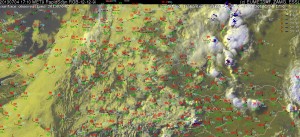
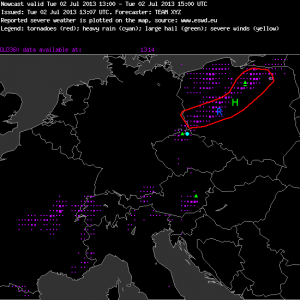
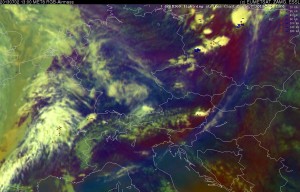
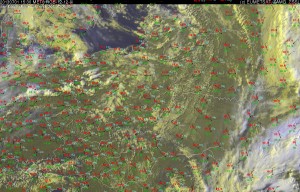
The most interesting storm concerning this matter was the Southeasternmost storm over the Czech Republic, which can be seen in Fig. 5, a recycle of the 1355 UTC nowcast snapshot already included in yesterday’s post. This storm showed the highest radar reflectivity and started to move Southeastward (!) into Austria soon after this snapshot. It kept its highly deviant motion for one and a half hours, which meant that it could savour on particularly rich inflow of Southeasterly near-surface winds and on even higher storm-relative helicity. It can be concluded that this “storm of the day” was at least a strongly propagating multicell or possibly even a supercell. At 15 UTC it hit Litschau at the Czech/Austrian border with plenty of (rather small) hail, 21 mm precipitation within 20 minutes, a maximum gust of 65 km/h and a temperature drop from 25 to 14°C, before it clustered with the rest of the Austrian storms while all of them started to weaken. This case is another reminder that mesoscale processes (especially over structured terrain like in many parts of Europe) can favourably modify the conditions for better organized storms even if the large-scale setup looks inconspicuous.
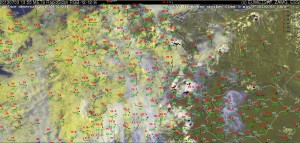
Fig. 5: Nowcast display at 1355 UTC Wed 3 July 2013: Meteosat E-View satellite image, latest SYNOP reports (13 UTC) and lightning detections within the last 5 minutes.
The Testbed participants enjoyed the well-deserved joint dinner tonight. Five of us ended up in Clumsy’s Pub afterwards, where we added a new meaning to its name by playing a small table soccer tournament (until we ran out of coins). It was another clear and pleasant summer evening in Wiener Neustadt. The Alpine storms can be well observed from here each afternoon, but tomorrow is the last and only remaining chance during this first Testbed week for a stray thunderstorm to hit us on-site.

