This short article discusses the conditions leading up to the devastating flash floods in the Valencia region on 29 October 2024. We also briefly discuss some storm characteristics from the perspective of the satellite data. Please note that we concentrate on the meteorology, but neither climatology nor the social aspect of the disaster, making this writing far from exhaustive.
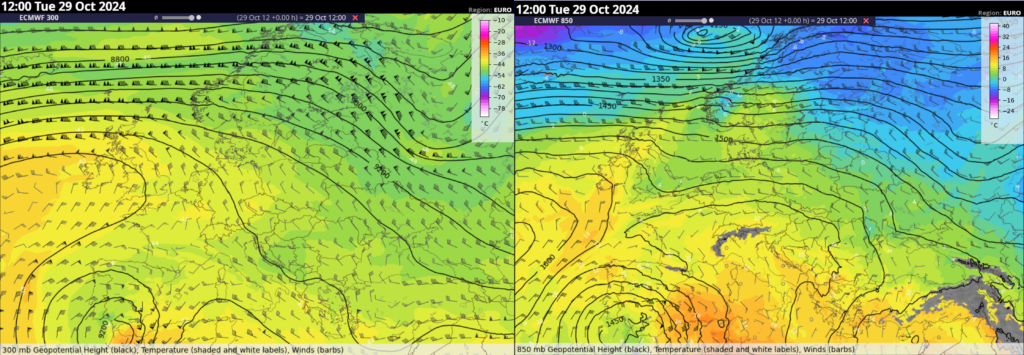
The synoptic scale was characterized by a deep cut-off low over northwestern Africa and southern Spain. At the upper troposphere, a left exit region of a jet streak was located over southeastern Spain and shifted north during the day. Closer to the ground, a strong easterly low-level flow, with wind speeds up to 25 m/s at 850 hPa overspread eastern to central Spain with persistent warm air advection across the area. The low-level jet was lifted over the local topography on the eastern coastlines, initiating the development of the storms.
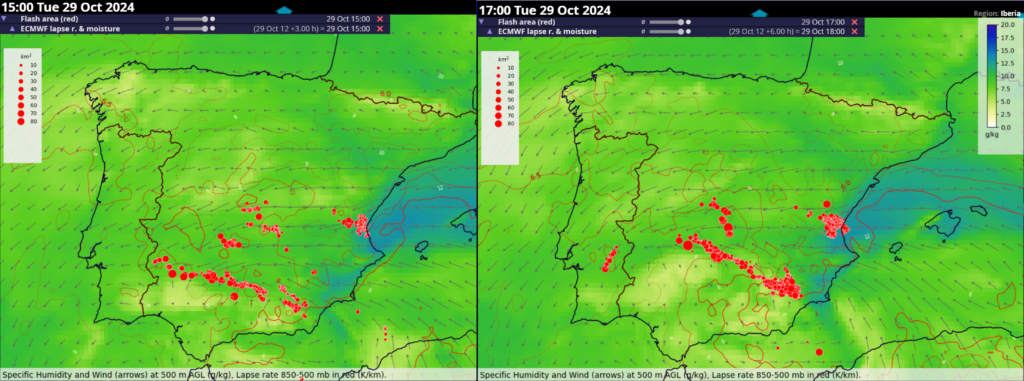
Southerly mid-tropospheric flow advected steep lapse rates from the Sahara over the Balearic Sea. The models simulated a notable overlap of steep lapse rates (exceeding 7 K/km between 850 and 500 hPa) and abundant lower tropospheric moisture (exceeding 12 g/kg in the lowest 500 m). This yielded a high CAPE environment, especially over the sea and coastlines. Figure below shows the persistence of these ingredients just east of Valencia as the quasistationary storm was happening. High CAPE combined with substantial vertical wind shear, a situation with a high conditional probability of severe weather should storms form.
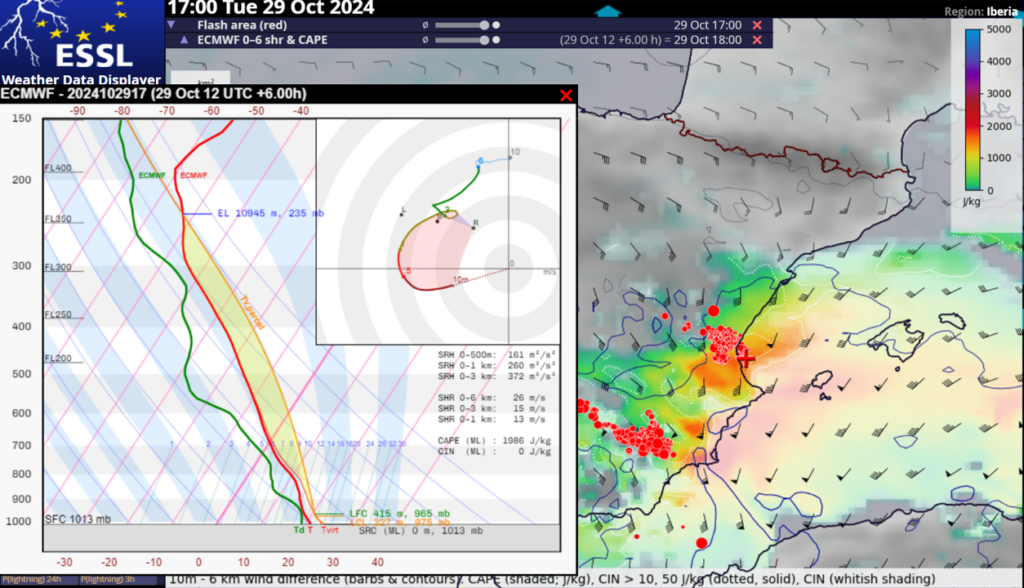
The storm produced high rainfall intensities over several hours, and at least three tornadoes rated IF1, IF1.5, and IF2. According to AEMET, the hourly record rainfall in Spain was broken in Turis, with 184.6 mm in 1 hour and 42 mm in just 10 minutes. Overall the station received 771.8 mm in 14 hours. Weather station Chiva reported 491.2 mm in 8 hours, 343 mm in 4 hours, and 160 mm in 1 hour.
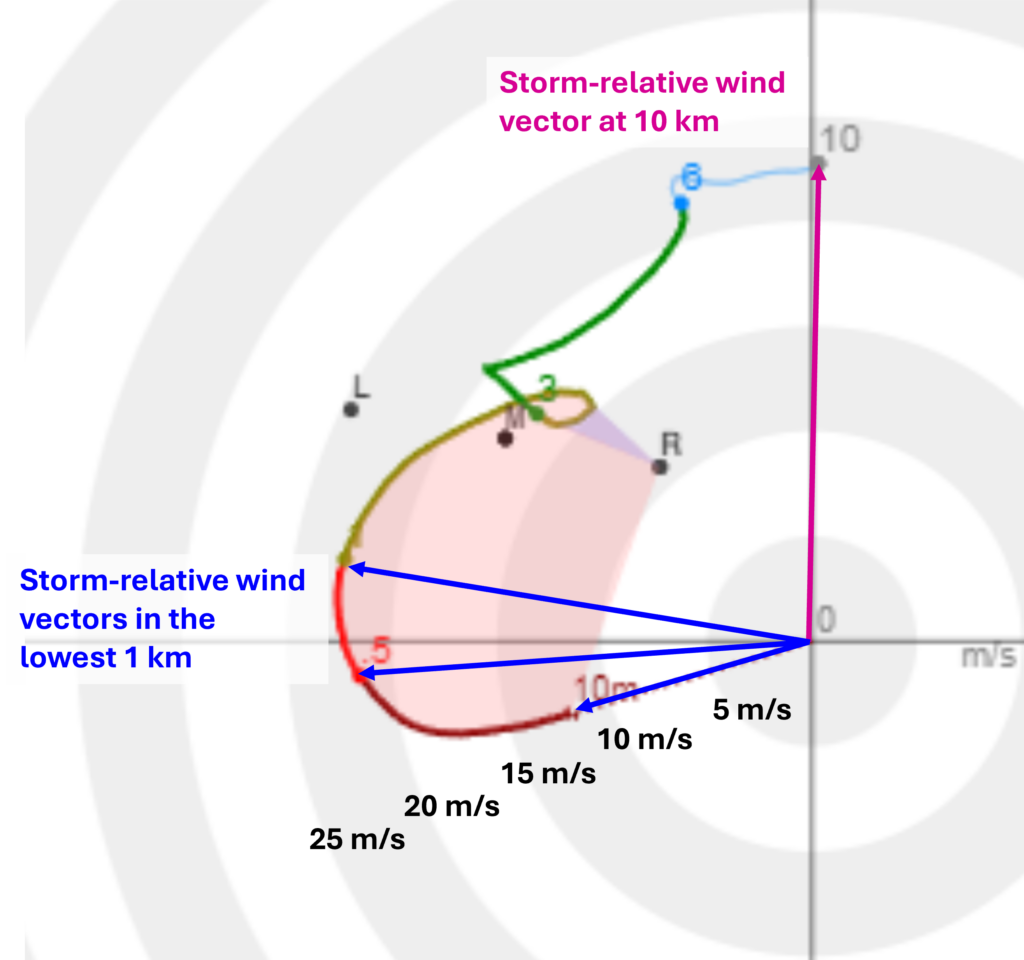
Because extreme rainfall produced a much larger impact than tornadoes, we will mostly concentrate on the ingredients-based forecasting of this phenomenon, following the work of Doswell et al. (1996). The authors separate the ingredients for rainfall intensity and its duration. The intensity is a function of the supply of low-level moisture, its vertical flux, and the “efficiency”. The efficiency is the ratio of the amount of rainfall that reaches the ground to the amount of rainfall formed in the storm. The evolution of the forecast temperature and humidity profiles and hodographs just east of Valencia in the inflow zone of the storm shows an improvement in the ingredients for high rainfall intensity between 12 and 15 UTC.
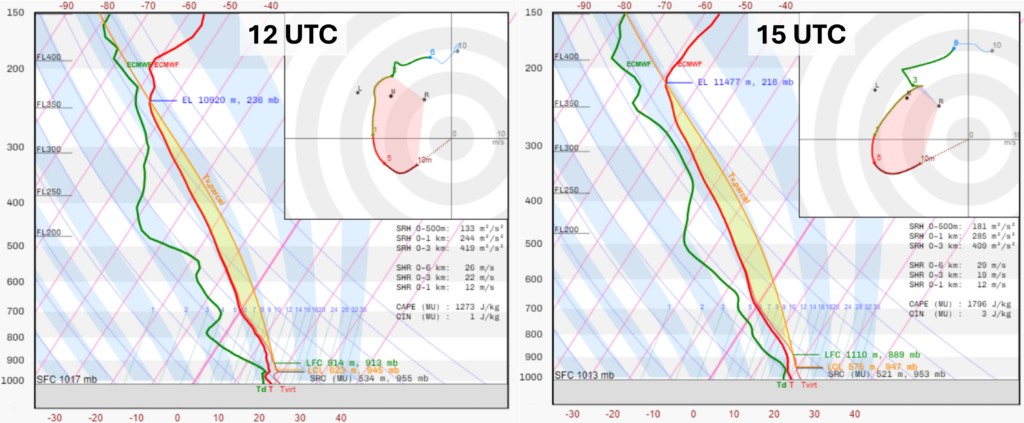
By 15 UTC, these ingredients were present over the area:
- High absolute moisture content in the lower troposphere rapidly advected towards the coast with wind speeds up to 25 m/s in the bottom 500 m.
- High potential for rapid vertical flux of moisture due to high CAPE
- High precipitation efficiency due to low-cloud bases, and high relative humidity in the low to mid-troposphere, resulting in a low potential for evaporation of rainfall.
- Considerable depth of the cloud available for the growth of raindrops through collision and coalescence, given by the large distance between the lifted condensation level and the 0° isotherm (so-called deep warm cloud depth)
The intensity and the width of the precipitation swath were likely increased by the presence of strong vertical wind shear, both in the bottom 1 km and above it. Observations and idealized simulations have shown that precipitation rates are increased through shear-induced enhancement in the low-level updrafts (Smith et al. 2001, Nielsen and Schumacher, 2018 Nielsen and Schumacher, 2020). The width of the precipitation area is also increased by the stronger shear (and conversely, strong inflow) producing wider updrafts (Mulholland et al. 2024). This was especially important in this case, which featured low cloud bases, which typically result in narrower updrafts.
Precipitation fell over the area in several rounds. The first convective system affected the Valencia region already in the morning hours. A decrease in activity was noted during the late morning with drier air in the low to mid troposphere advected over the region. The main phase with a quasi-stationary storm started around 14:30 UTC and lasted till 18 UTC.
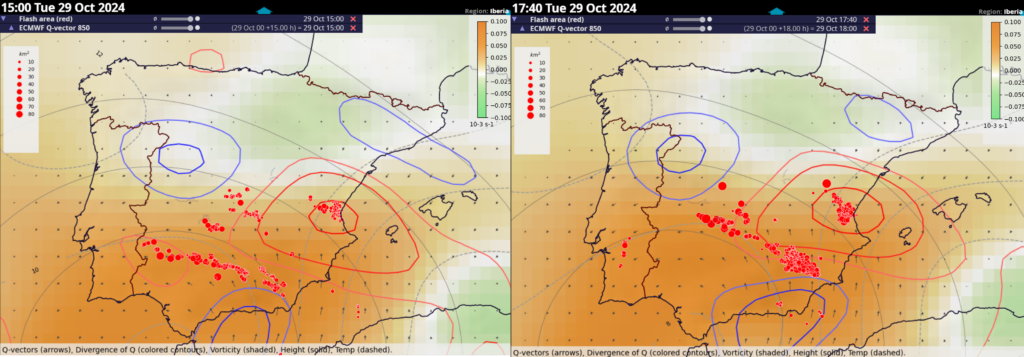
There were several factors contributing to the quasi-stationary nature of the storm in the area:
- Persistent maximum of synoptic-scale lift at 850 hPa caused by warm air advection
- Persistent strong easterly onshore flow ascending the local topography
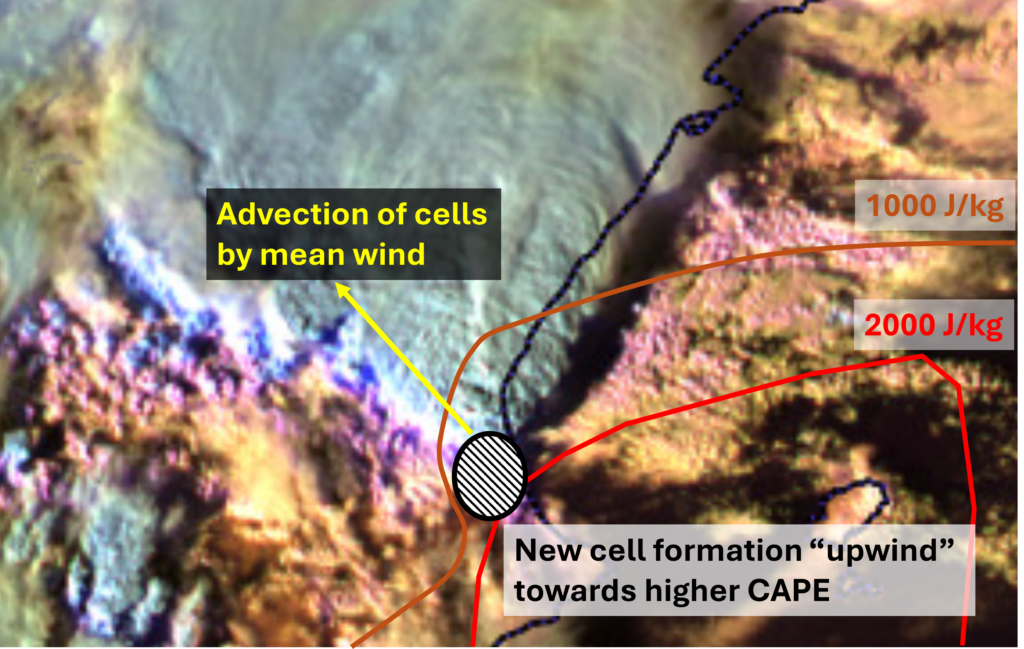
- Tongue of higher low-level moisture and CAPE upwind of the initiating storms resulted in back building
- High relative humidity in the low troposphere combined with low cloud bases. This resulted in weak or absent cold pools that would push the initiation of new cells to other locations.
The storm showed the typical pattern for quasistationary rainstorms in the Mediterranean, with the higher moisture and CAPE remaining over the sea, while the storms form over the coastline and are advected further inland. This results in opposing directions of cell advection by mean wind and new cell formation towards the area of higher CAPE. This process applied in this case and is schematised below.
The storm that ensued looked extremely intense from the satellite’s perspective. It displayed a persistent, cold, and wide overshooting top with a long above-anvil cirrus plume advected in the direction of upper tropospheric storm-relative winds. Both features are shown in the figure below. The animation of the “Sandwich” (combination of visible and infrared channels) shows the long-lived nature of the features as well as the rapid expansion of the anvil. The above-anvil cirrus plume becomes more prominent towards sunset as the low sun angle creates longer shadows.
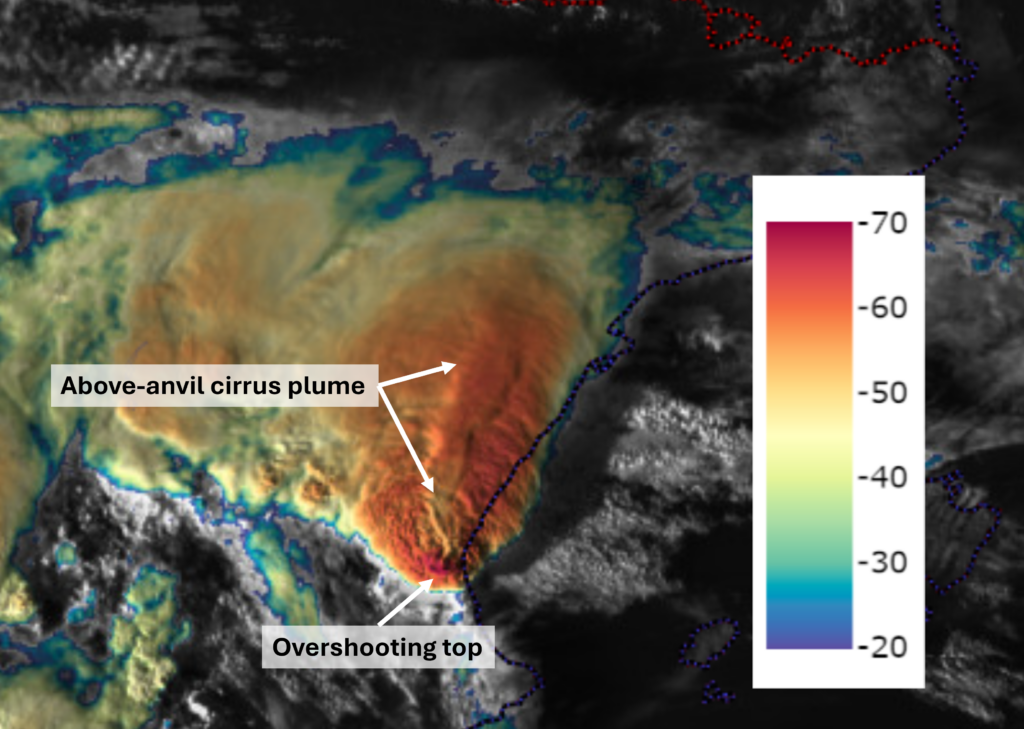
The nature of the storm top features reflected the environment in which the storm formed characterized by high CAPE and strong upper tropospheric storm-relative winds, which helped to create a hydraulic jump downwind of the overshooting top (Homeyer et al. 2017). The quasi-stationary nature of the main updraft of the storm resulted in strong storm-relative flow both in the upper troposphere and near the surface. The storm-relative inflow reached up to 22 m/s in the bottom 1 km, which greatly increased the updraft width and the vertical moisture flux (Peters et al. 2020). Interestingly, although the storm had a persistent, strong, and wide updraft in the upper troposphere, there was no large hail reported to the European Severe Weather Database.
Strong moisture flux through the charging region of the storm resulted in very high lightning activity. Some of the products available from the new Lightning Imager are shown below, showing a high density of lightning in the core of the storm. Some of the flashes were also detected from the southern side of the storm due to the angle of the scanning of the satellite, forming a curious U-shape around the edge of the anvil.
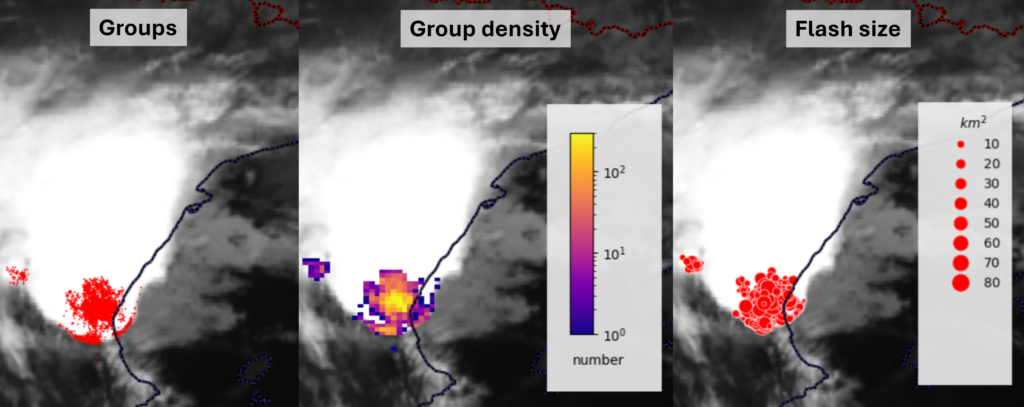
the Lightning Imager and disseminated products can be found here.
In summary, a high-end environment for severe convective storms existed over the area from the perspective of high CAPE and strong vertical wind shear. This resulted in well-organized storms with strong updrafts and a high precipitation intensity. The continuous strong onshore flow of a very moist airmass, in combination with a persistent maximum in the low-level synoptic- and mesoscale-scale lift over the area kept the updraft redevelopment locked in the same position for several hours. This resulted in the extremely high precipitation intensity to persist for several hours.
Last but not least, ESSL would like to extend its deepest sympathies and condolences to the people of Spain, who have suffered from this horrifying natural disaster.
