Historical Deadly Flash Floods in Spain

Our ESWD team extracted the 10 most deadly flash flood events from the European Severe Weather Database for Spain. Here is the overview:

RankNumber of fatalitiesDatePlace or region
15000 *13 OCT 1403 Mallorca island
2777
likely >1000 including Orihuela
14+15 OCT 1879Murcia (region)
381525 SEP 1962
Vallés Occidental (region, Catalunya)
4>200 **
29 OCT 2024
Valencia urban area (Valencia)
58707 AUG 1996 Biescas (Aragon)
68509 OCT 1787
Tortosa (Catalunya)
78419 OCT 1973 Puerto Lumbreras (Murcia)
88114 OCT 1957
Valencia urban area (Valencia)
950
18+19 OCT 1973Albuñol Valley (Andalucia)
1033 06 OCT 1863 Llobregales (Valencia)

* The number of fatalities of this medieval event comes with a large uncertainty.

** Number of fatalities as of 2 November 2024. The official numbers are not final yet and likely to change.

The fact that nearly all events occurred in the month of October is striking. The flood event of 29 October 2024 is the deadliest in Spain in more than 60 years and the deadliest so far this year in the whole of Europe and the Mediterranean, i.e. in all regions covered by the ESWD.

We plan to post an in-depth meteorological analysis of the event early next week.

Note: This article was originally posted on 31 October 2024 at 18 UTC and updated at 20 UTC. The “1962 Vallés floods” event was added with the update. The 1962 event ranks on the third position now. We are thankful for a hint to include this important event. Another update on 2 November 2024 at 20 UTC corrected fatality numbers for events on 25 September 1962, 14+15 October 1879, 18+19 October 1973, and 29 October 2024.

MTG LI at ESSL-EUMETSAT Forecaster Testbeds

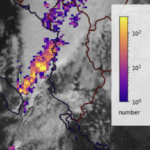
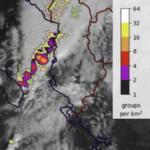
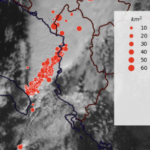
Within the context of the cooperation between EUMETSAT and ESSL on user preparation for the MTG data, an experimental visualization of Lightning Imager (LI) data was introduced to the ESSL Weather Displayer. Its preliminary name is “Geometry and density” and it connects all the detected LI groups (connected pixel detections at one acquisition frame of 1 ms) within one single LI flash (collected LI groups that are correlated in space and time within 330 ms) and can be taken as a proxy for the geometry of the flash as seen from space. Each flash is given a different colour. Such a flash geometry can cover large areas, something that has earlier been discovered by using the ISS-LIS and GOES-GLM instruments. In the ESSL Weather Displayer, the visualization combines this information with data on highly active convective cells. Those active cores are made visible via plotting the LI group density if surpassing 1 LI groups per km² within a 5 minute time frame (colour shading from black via magenta, red, orange and yellow to white). Possible applications of such a product may range from public outreach activities via identification of new active updrafts all the way to lightning safety at airports.

LI group density is also visualized in gridded form. In addition, the area size of flashes is plotted for each single flash (the size of red or yellow circles related to the flash area). This allows a forecaster to identify physical processes that are ongoing within a convective complex. Large flash areas are typical for flashes in the stratiform regions while a high number of small flashes can be indicative for a very intense updraft, as it is often seen with supercells in early LI data.

You can read the full newsletter here.

Figures: Screenshots from ESSL Weather Displayer for a geographic area of Albania and surroundings on 4 October 2024 at 09:00 UTC. Left: LI Group Area (red circles). Middle: LI Group Density. Right: LI Geometry and Density (geometry approximation of LI flashes and LI group density above 1 for identification of active convective cores). Data source: EUMETSAT. Visualization: ESSL.